Analyze the testing coverage of your C++ code
Writing unit tests is a great way to ensure that your code is behaving correctly. But how can you tell how much of your code are you testing? The GCC compiler provides tools to analyze the testing coverage of your project. In this post, I will show you how to integrate these tools in a CMake project.
Get the code on GitHub
GCC provides a testing coverage tool called gcov. It creates log files that register how many times a code line has been executed. Using gcov out of the box is as easy as compiling your code with some special flags:
gcc -Wall -fprofile-arcs -ftest-coverage -O0 main.c
Then, you run all the tests for that code, and call gcov. This is an example output:
$ gcov main.c
 88.89% of 9 source lines executed in file main.c
Creating main.c.gcov
The generated .gcov files are copies of our source files, but with counters for every line that was executed. Though these .gcov files give you the information you need, it would be great if we could generate more detailed reports. We can actually do this using lcov, a tool that creates HTML reports based on gcov’s output.
Requirements
To install the coverage tools, you ought to have GCC, CMake, and lcov installed. To get my CMake template project, go over to my previous post, and follow the steps. The template already has a sample program with unit tests. However, you can follow this post, and install the coverage tools in your own CMake project.
Getting the test coverage module
Configuring gcov and lcov for CMake can be quite complicated. To make things easier, we will download a CMake module from this repo. Let’s create a folder called CMakeModules in our project, and save the module file there.
Setting out our CMake
First, we need to declare the name of our testing executable in CMakeLists.txt. This is the executable that our coverage tool will run for the testing coverage analysis.
set (PROJECT_TEST_NAME ${PROJECT_NAME}-ut)
Next, we need to set our CMake module folder to CMakeModules:
# Folder where the Coverage module is
set(CMAKE_MODULE_PATH ${PROJECT_SOURCE_DIR}/CMakeModules)
Finally, we need to configure the coverage target:
# Code coverage
if (CMAKE_BUILD_TYPE STREQUAL "Coverage")
    set_target_properties(${PROJECT_NAME}
        PROPERTIES
        COMPILE_FLAGS "-O0 -fprofile-arcs -ftest-coverage"
    )
    include(CodeCoverage)
    set(COVERAGE_EXCLUDES
        '/usr/*'
		'${PROJECT_SOURCE_DIR}/tests/*'
		'${CMAKE_BINARY_DIR}/googletest-src/googletest/include/gtest/*'
		'${CMAKE_BINARY_DIR}/googletest-src/googletest/src/*'
		'${CMAKE_BINARY_DIR}/googletest-src/googlemock/include/gmock/*'
        '${CMAKE_BINARY_DIR}/googletest-src/googlemock/src/*'
    )
    SETUP_TARGET_FOR_COVERAGE(
	NAME coverage
	EXECUTABLE ${PROJECT_TEST_NAME}
	DEPENDENCIES ${PROJECT_NAME}
    )
endif() #CMAKE_BUILD_TYPE STREQUAL "Coverage"
First thing we need to do here is add the compiler flags to enable gcov. We also need to add the flag to disable optimizations. The include command will add the CMake module we downloaded to our project. Then, we need to declare all the folders we want to exclude from the analysis. Finally, the SETUP_TARGET_FOR_COVERAGE command makes all the magic happen. We will have a coverage target that will run the executable we declared, and create the coverage report in our build folder.
Running the test coverage analysis
To run the analysis, we need to build the project using the Coverage build type:
mkdir build
cd build
cmake -DCMAKE_BUILD_TYPE=Coverage ..
make
make coverage
If these commands executed succesfully, open build/coverage/index.html file in a web browser. It will look like this:
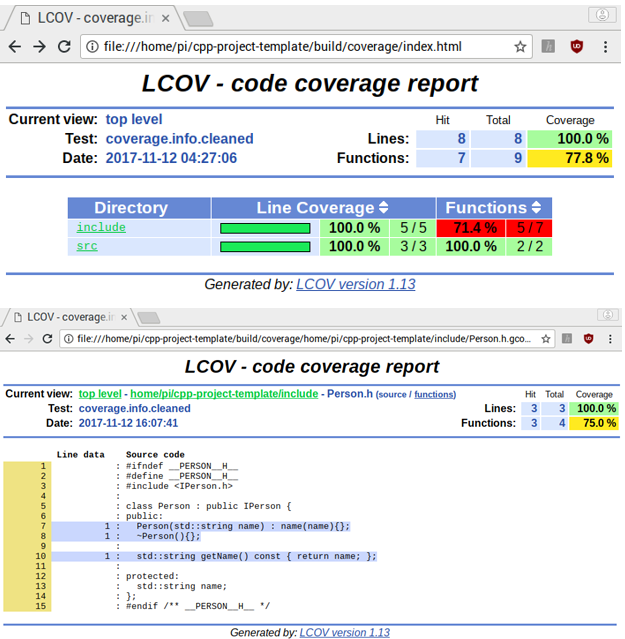
Now you have all your coverage information in one report! You can navigate through your code and check which parts need testing. Let’s modify our sample program a little bit, and add some validations to our Person constructor. We will change it to throw an exception if the name comes empty:
#include <stdexcept>
#include "Person.h"

Person::Person(std::string name) {
	if(name.empty()){
	    throw std::invalid_argument("Name cannot be empty.");
	}
	this->name = name;
};
Let’s run the analysis again with make coverage:
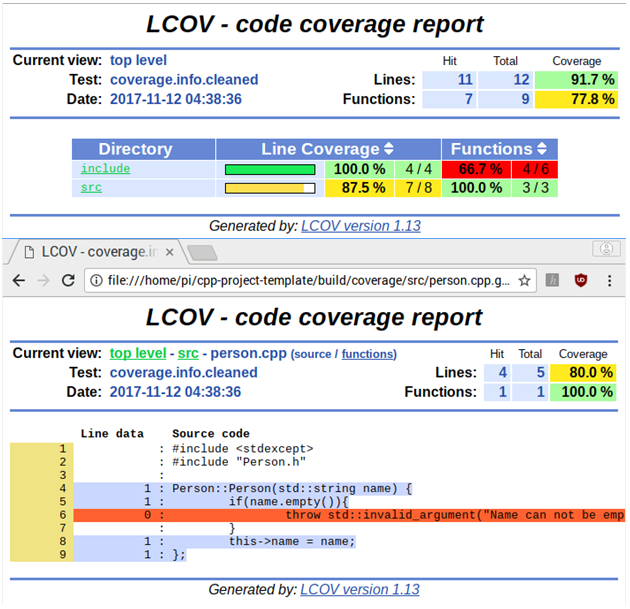
We can see that line 6 is not being executed by any unit test. Let’s add two unit test to be sure we are covering both branches of the constructor:
TEST(GreeterTests, PersonValidCtorTest) {
	ASSERT_NO_THROW({
		Person p{"Alexa"};
	});
}

TEST(GreeterTests, PersonInvalidCtorTest) {
	ASSERT_THROW({
		Person p{""};
	}, std::invalid_argument);
}
A final run of the analysis will tell us that our code is 100% covered again:
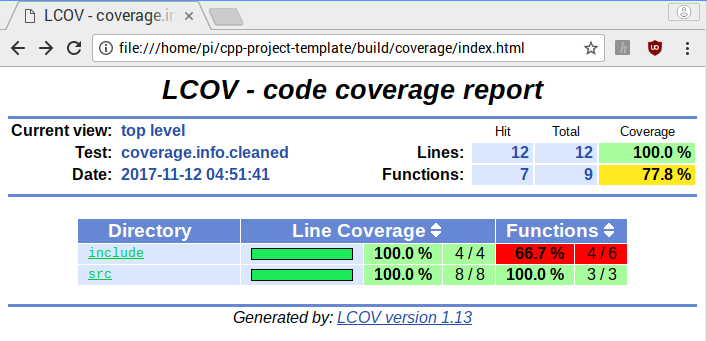
That’s pretty much it, now you have a tool to measure the coverage of your tests. You can use this coverage tool to analyze the coverage of other tests, such as component and feature tests. Further, you can integrate this analysis in CI services, like Travis CI and Jenkins.
Useful links
Get the code on GitHub